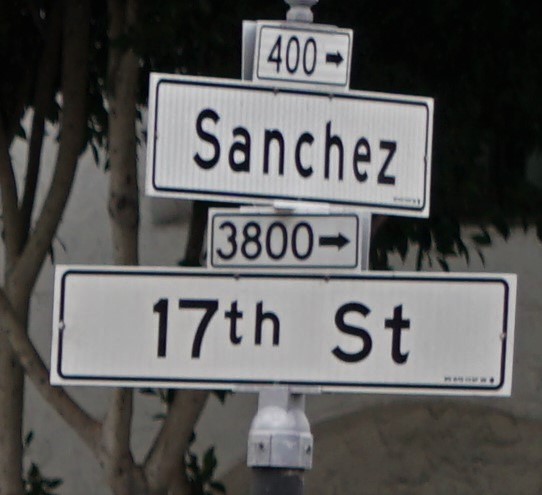
17th Street between Church St. & Sanchez St. by the numbers
Two weeks in review
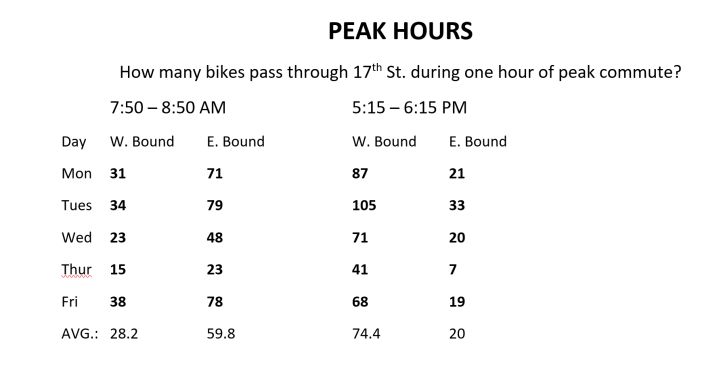
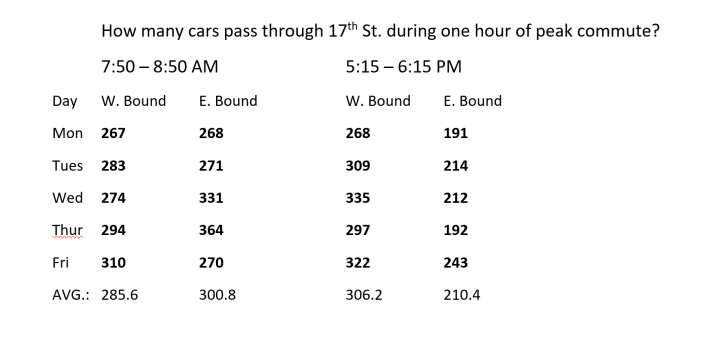
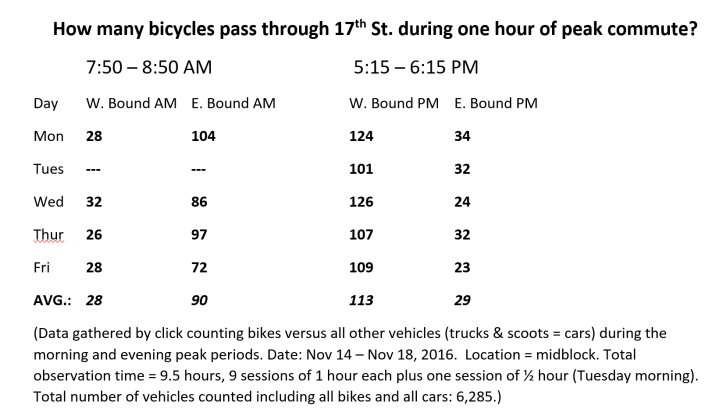
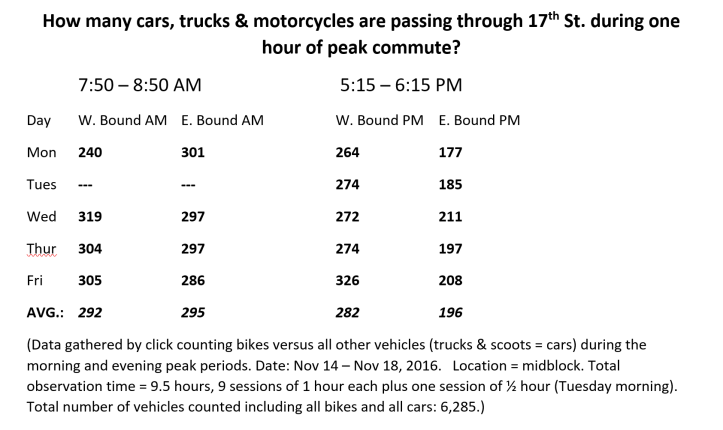
Vehicle counts conducted with great care by John Entwistle over two five-day work weeks from Nov 14th through Nov 18th, 2016 And Nov 28th through Dec 2nd, 2016. Weather was good all week for both weeks. Counts were kept on click counter devices for accuracy. [Click here for the official SFMTA Traffic Count Data for the entire city and please note the lack of local data.]
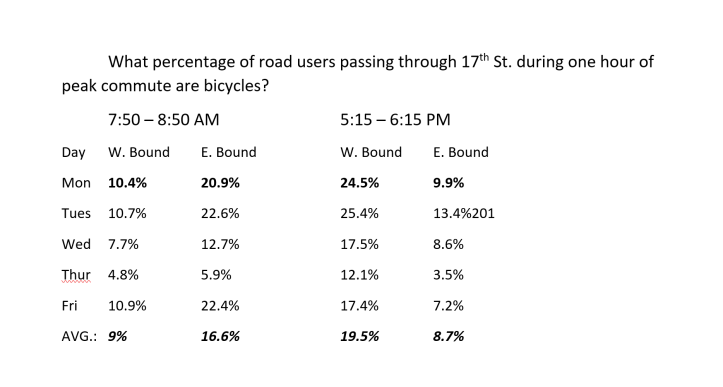
Rush Hour Data

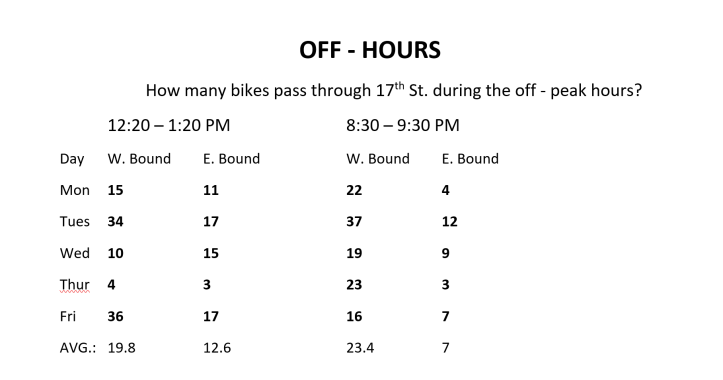
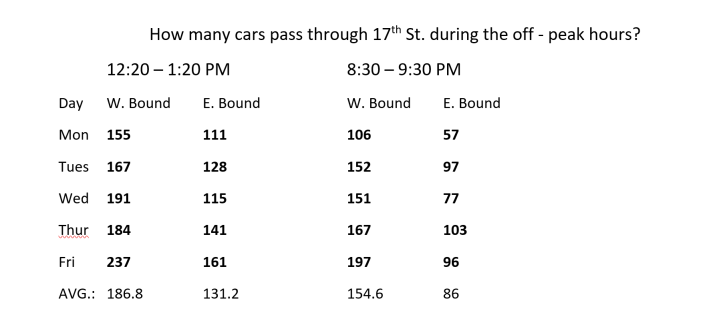
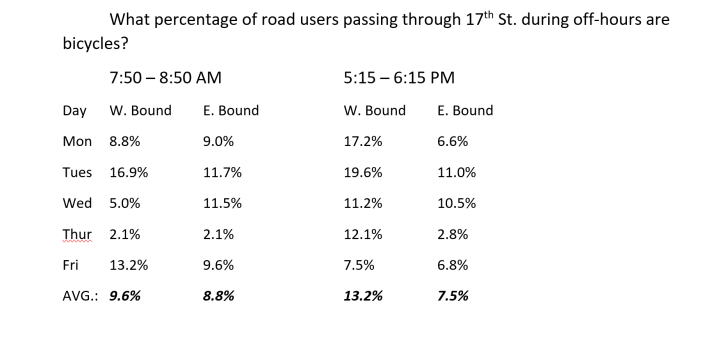
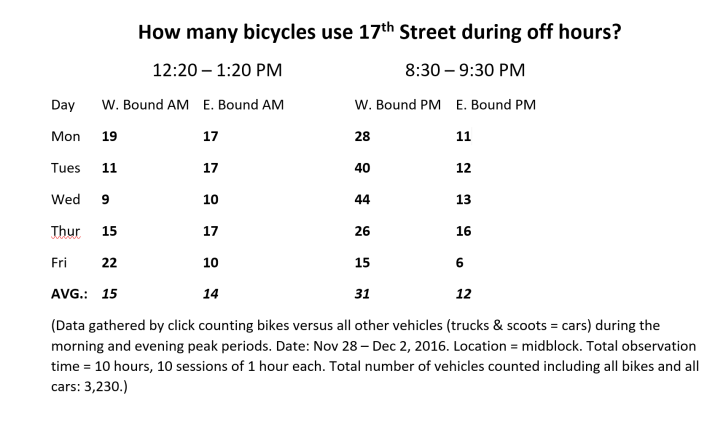
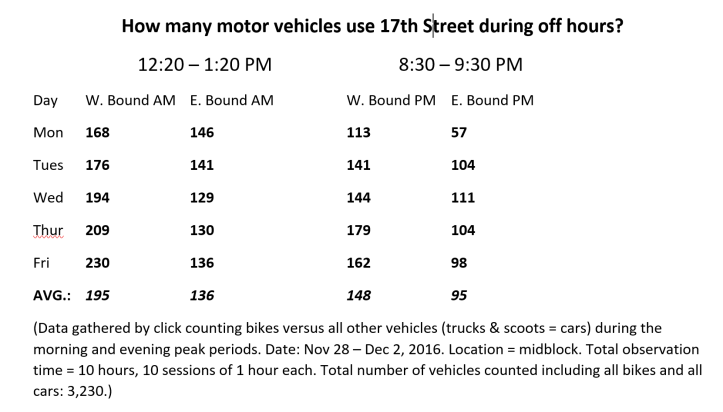
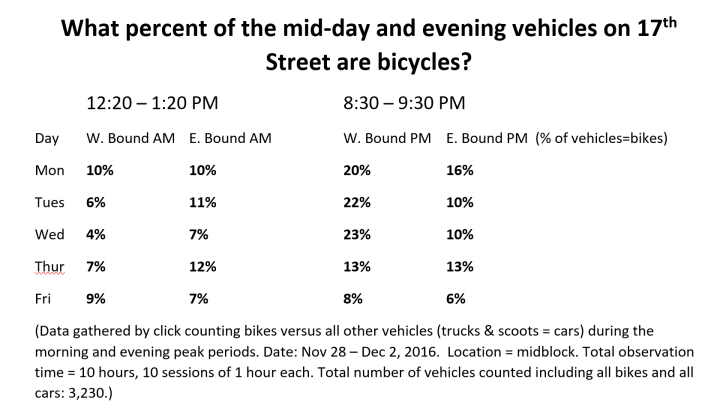
Off Peak Hours (Mid-day and evening)
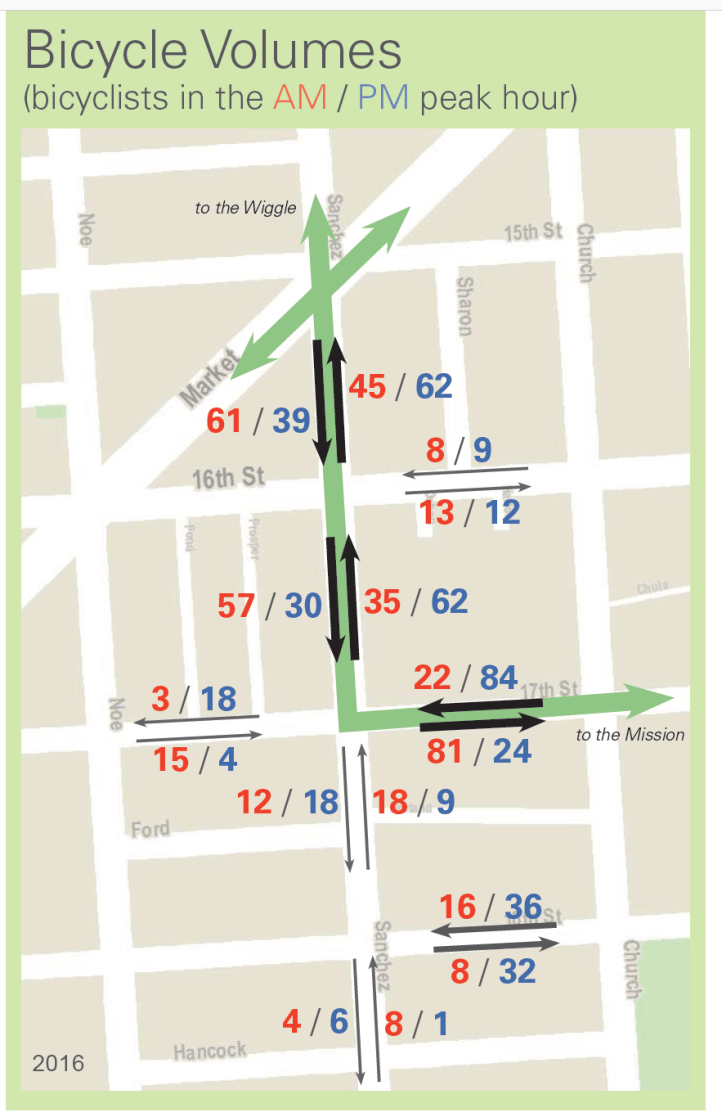
Update 3-30-2017: In a recent open house hosted by SFMTA at Mission Station on February 22, 2017 several boards were presented to the public with all sorts of info compiled by SFMTA. One of those contained a bunch of bike counts for 17th Street and nearby streets as well all laid out on a map type graphic. They have lower numbers than I do for 17th Street but that could be explained by any number of things such as the time of year or specifics on the day they counted. In any case here’s the SFMTA data map below:
2017 Data
All data below taken at the same time of the year as the 2016 counts and in the same location.