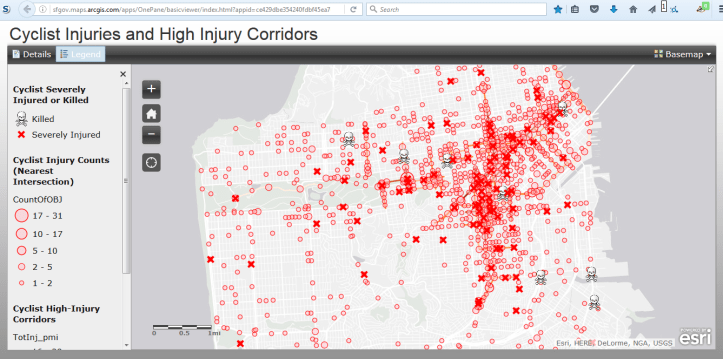
The maps clipped below are from the City & County of San Francisco which produces some fairly good graphics. Unfortunately these maps only reflect reported cases and the vast majority of the injuries on 17th Street go unreported and unattributed to any cause officially. The unofficial local count is 200+ persons seriously injured per year on 17th Street between Church & Noe Streets.
But these maps do give you a sense of perspective and cause to question some of the “short cuts” and compromises the City has employed in developing the bike paths to date such as maintaining parking by moving the bike path to the door zone or making bikes, cars and streetcars “share a lane.” The sad truth is San Francisco’s bike system is still far too dangerous for children and the majority of adults.
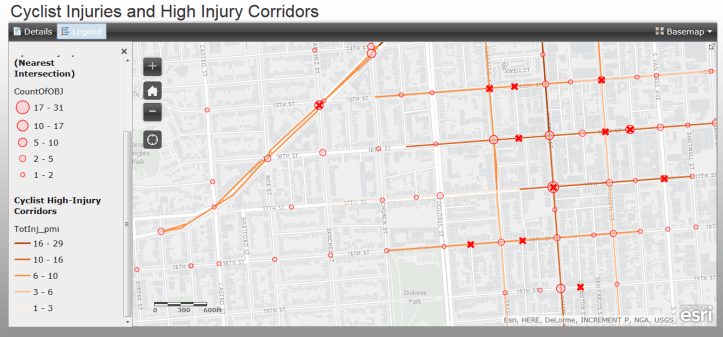
Cyclist Injuries & High Injury Corridors
Next we zoom into our Street…
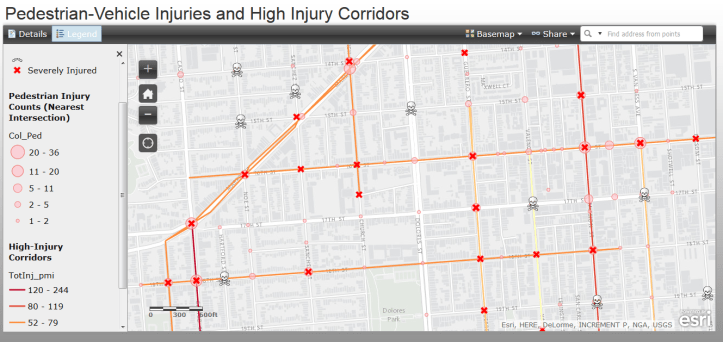
Pedestrian-Vehicle Injuries & High Injury Corridors

Next we zoom in on 17th Street in the Castro district…
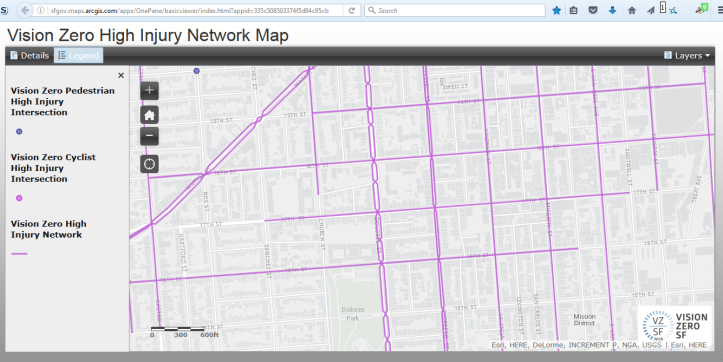
High Injury Network Map
SF MTA gets a lot of money from San Francisco Voters
These are a few recent articles that give you some sense of the scale of the funding and the politics that effects how these funds are spent.
- “Voter-Backed Investments: Mapped, Tracked & Transparent” Erin Halasz, Monday, April 27, 2015 in Moving SF
- “Transportation 2030 Roads+ Transit + Safety“by OneSF, 2016
- “57 Initiatives Given High Priority in Next Round of Vision Zero Projects” Kristen Holland, Friday, July 1, 2016 in Moving SF
- “Posts from the Bike Plan Category“, STREETSBLOGSF, 2013 — Several good articles all in a row.
And one final link back to our sister site for the video of the mother with her two children getting completely smashed to the ground by MUNI’s tracks on 17th Street on May 19, 2016. MUNI has still not acknowledged responsibility for causing this collision and has done nothing to stop it from happening again.
